Found total of 23 items and showing 11 items on page 2 of 2
Interested in Using VR in Your Research?


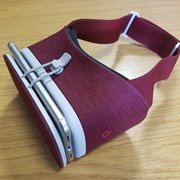
Research IT took part in the latest Digilab meeting at the end of November with the aim of showing off some of our new VR equipment and to demo them to researchers from across the university. A successful day was had with lots of interest in our HTC Vive and Google Daydream VR headsets and their applications in research. There was a mix of researchers who were already using VR in their research in some form to researchers who were trying VR for the first time. Hopefully they left with some inspiration on how VR could be used in their research!
Research IT Involved in Major BBC Partnership


The university has recently announced a 5 year partnership with BBC Research and Development and seven other UK Universities to unlock the potential of data in the media. We are pleased to say that Research IT staff will be using their expertise in several areas of this important project.
Data Visualization Equipment Expertise Available

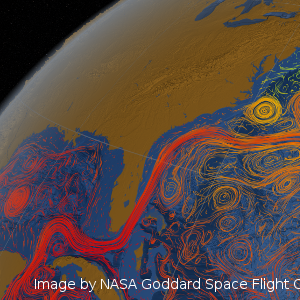
Touchscreens are very popular for research data visualization but any system deployed must work smoothly and intuitively. There are a wide range of systems available - from expensive purpose-built systems for exhibitions to simple tablet/phone software options available for touching and manipulating data. How do you know which one to choose?
Registration open - Advances in Data Science


Registration is now open for this year's Advances in Data Science 2017 conference. The event is a two-day meeting to present recent developments in data science, with a focus on advanced analytics (machine learning, Bayesian statistics, scalable algorithms), privacy, visualisation, software and diverse applications. Speakers include leading data scientists from industry and academia.
Advances in Data Science Conference


The University of Manchester Data Science Institute has announced a call for abstracts for their 'Advances in Data Science' Conference to be held on the 15th – 16th May.
The conference is a two-day meeting to present recent developments in data science, with a focus on advanced analytics (machine learning, Bayesian statistics, scalable algorithms), privacy, visualisation, software and diverse applications. Speakers include leading data scientists from industry and academia.
Win Amazon vouchers by evaluating software


The deadline for participation in the evaluation of visualization tools has been extended until the 18th of September 2016. Participants currently have an excellent chance of winning an Amazon voucher worth £250, £150 or £100!
Full details of the simple process to evaluate the software on offer and how to submit your feedback can be found on our visualization blog post.
Research Data Visualisation Workshop


The Software Sustainability Institute (SSI) will be running the Research Data Visualisation Workshop on July 28th, 2016 at the University of Manchester. If you create data visualisations and plan to visualise new data sets or would like to know about data visualisation toolings and uses then this is the workshop for you.
Help shape the future of Data Visualization at the University of Manchester


And be in with a chance of winning £250, £150 or £100 of Amazon Vouchers!
The demand for visualization of datasets through the creation of meaningful and attractive representations of data, and to provide insight and greater understanding of data is rapidly growing. There are many existing applications, ranging from Excel to more sophisticated and complex software like Matlab, Python, R, Mathematica, and STATA.
From feedback, we have identified a need for an application that falls in between these two extremes and we would like your help in evaluating potential applications. This evaluation will help select an application for wider adoption across the University, along with training, support and central licensing.
We have selected Tableau, Qlik, Spotfire and IBM Watson Analytics for a more detailed evaluation by the community.
Research IT Core Application Suite


Earlier this year Research IT requested feedback on a proposal to implement a ‘core research application suite’ that would focus support, training and licence resources on a selected suite of applications chosen to offer maximum value to University researchers.
Many thanks to all of you who took the time to contribute to this review, your input was very valuable. Based upon the feedback received it is clear that there is demand for the implementation of a general data visualisation tool (e.g. Spotfire, Tableau) and we are now proceeding with an evaluation of a set of candidate tools with the objective of selecting and deploying such a tool later this year.
Have your say on visualisation tools


We are looking for volunteers to help evaluate a number of general data analytics and visualisation tools to bridge the gap to more specialised software such as MatLab and Python.


