As part of the Turing Innovation Catalyst programme, the University of Manchester partnered with local company, GrafMarine who specialise in intelligent power management for the maritime industry. Their systems have been shown to cut marine fuel consumption on vessels, such as oil tankers and bulk carriers, by up to 10 %. Each litre of fuel saved prevents around 3 kg of CO₂ emissions, thereby substantially reducing fossil-fuel use and carbon output across the sector.
The Research IT team were tasked with working with GrafMarine to develop a prototype simulation. This prototype will help to optimise the utilisation of power for ships, power which is being generated by GrafMarine’s modular solar energy system, NanoDeck.
The Challenge
The marine industry must decarbonise to achieve Net Zero and, from 2027, the International Maritime Organization (IMO) will enforce legally binding regulations to cut carbon dioxide and other greenhouse-gas (GHG) emissions from shipping.
- Optimising solar power for maritime operations presents some additional technical and operational challenges.
- Capacity Planning: Choosing the right number of solar panels and battery capacity for each shipping route.
- Contingency Planning: Identifying times when solar energy and batteries are not sufficient to meet the total energy requirements of the ship, so that alternative energy sources can be provided if necessary.
- Data Handling: Merging solar output, battery state, engine draw and other relevant sources of data.
- Power Management: Deciding in real time whether to use solar power immediately or store it in batteries for later.
The Team
The team that worked alongside GrafMachine was drawn from several Schools across the University as well as Research IT.
- The development was led by the project PI Dr Arijit De (Alliance Manchester Business School).
- The project was supported by four other Co-I's – Prof. Alice Larkin, Dr Simon Bullock (both Civil Engineering and Management), Prof. Richard Allmendinger and Prof. Yu-wang Chen (both Management Sciences).
- A team of four Research Software Engineers from Research IT – Catherine McGuire, Chris Fullerton, Chris Lam, Gerard Capes, and a Research Software Engineer from AMBS - Qian Zhao.
Ways of Working
With such an interdisciplinary team spread across so many areas of the University as well as GrafMarine itself, it was important that the project was well coordinated. We followed an Agile software development process under the guidance of Arijit De and Chris Fullerton. Working in two-week sprints, we built and iterated on a prototype app, turning raw Excel data into an interactive visual tool.
We did this by:
- Cleaning, standardising and exploring the provided Excel spreadsheet data using Python (pandas), to uncover patterns in solar output, battery levels and route data.
- Working from a central GitHub repository, enabling collaboration and version tracking.
- Testing local development in Docker, pyenv, and conda, allowing RSEs to work in whichever environment they preferred.
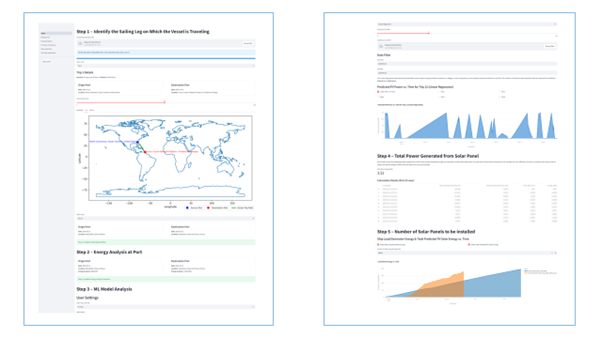
- Developing a five-step interface featuring:
- Route selection, allowing users to choose their sailing leg and view related data.
- Energy analysis at port, which calculate energy usage at each port call.
- ML model analysis, allowing users to configure and run a machine learning model to predict solar output against time under a variety of conditions.
- Total solar panel generation which calculates the total predicted power output from each solar tile.
- Solar capacity planning, which incorporates an interactive plot allowing users to investigate the number of solar panels required.
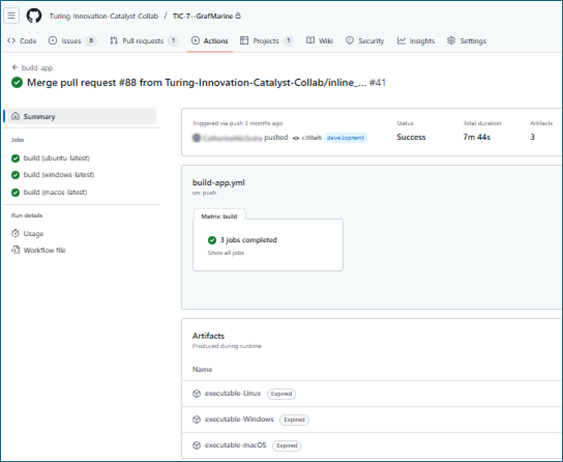
- Automated packaging via GitHub Actions to produce installers on every update, compatible with Linux, macOS and Windows, ensuring GrafMarine always had an up-to-date app they could download and run (Figure 1).
Furthermore, we developed a powerful simulation algorithm that accounted for various environmental factors (e.g., daylight hours, weather conditions, and port-specific energy requirements), which added even more complexity. The team addressed this by segmenting the sailing legs into smaller segments, ensuring accurate representations of energy capture and discharge from the battery during the voyage.
This simulation algorithm models the battery energy dynamics of a vessel as it sails between multiple ports. The methodology involves sequential computations that account for segment-based sailing, energy harvesting, and battery depletion over time.
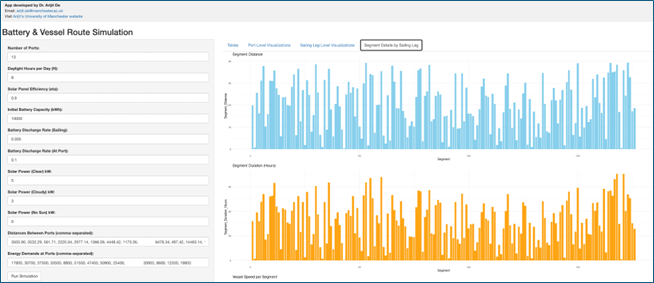
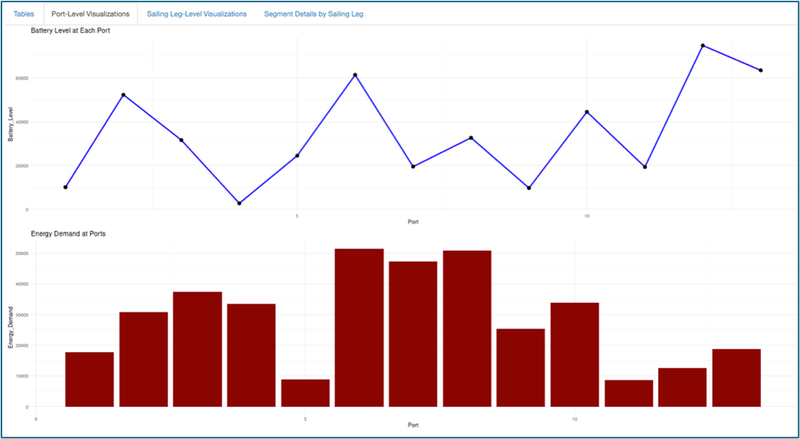
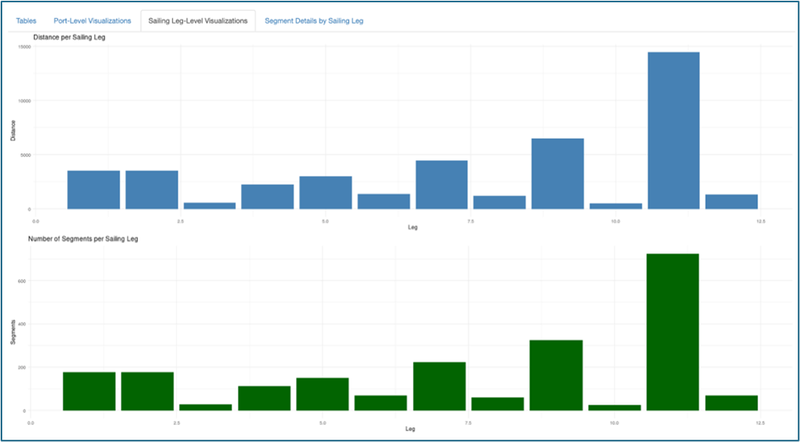
A rshiny app was developed on top of the simulation algorithm to provide detailed information about the port-level visualization, sailing leg-level visualizations and segment details related visualization. Figure 2 highlights the battery and vessel route simulation developed using the rshiny app.
Key Tools & Technologies
Over the course of the project the key tools and technologies used were:
- Python and pandas for data cleaning, transformation and analysis.
- Streamlit (and its built-in chart and map components) to build the interactive, multipage web interface.
- RStudio for Simulation Algorithm and RShiny for the Battery and Vessel Route Simulation App.
- Plotly for more advanced plots.
- Docker, pyenv and conda for flexible local development environments.
- GitHub and GitHub Actions for source control and cross-platform packaging
Impact & Outcomes
Ultimately the team demonstrated how AI-driven analysis of shipping routes and time-based energy measurements could optimise the deployment of GrafMarine’s modular energy tiles, enhancing the NanoDeck onboard energy solution.
The project also produced:
- Prototype tools which summarised and visualised available data, models energy usage on each shipping route, and allows the user to interact with the data, visualisations and models, packaged for download and able to run on a variety of local operating systems (Figures 1 and 2).
- A thorough analysis of GrafMarine’s existing data, enhancing their understanding of that data, it’s potential uses, and identifying additional data that could be obtained to further refine the models.
The project is an excellent example of application of machine learning, simulation, optimization and data analytics for real-world maritime transportation challenge.
“The project was a great insight for the adaption of our NanoDeck hardware technology using AI as ‘definition of use’ tool. The AI created asked questions about the vessel use and allowed complete electrical energy analysis under one combined analysis. Really grateful to Arijit and his team for putting this together in way that was logical and useful to prove the concept.”
Looking Ahead
The team would welcome the opportunity to progress these ideas into further analytics that will provide the right insight for commerciality and further live data adaption.
Potential next steps include:
- Obtaining further data in a variety of conditions (e.g. at different times of day, at different times of year, in different locations, in different weather conditions) to allow the models to be refined, and to be able to more accurately predict energy generation and usage on particular shipping routes.
- Further development of the prototype tools could include refining the models, and adding automation in order to pave the way for a ship-based real time data collection, data processing and optimised energy management.
If you’re interested in working with our RSE department on an AI-related project (large or small), get in touch with us via Connect and we’ll organise a meeting to discuss how we can work together. If you’re interested in getting involved in TIC’s CR&D projects, drop them an email for more information.