
Patients with cancer have significantly increased risk of mortality and severe complications from COVID-19 disease. By identifying the key features which predict severe disease, the patients most at risk of deterioration can be identified and admitted to hospital in a more timely manner.
CORONET (COVID-19 Risk in Oncology Evaluation Tool) is an online decision support tool, which Research IT have helped develop in order to address this issue. The website is publicly available and uses innovative visualisations to assist with clinical decisions in order to improve patient outcomes.
The tool has recently been acknowledged with the publication of a paper in the Journal of Clinical Oncology (JCO): Clinical Cancer Informatics journal. The paper explains how training data was collected and combined with clinical expertise to produce a Machine Learning model which can be accessed by healthcare professionals.
Background
CORONET was developed as a collaboration between Dr André Freitas and Dr Oskar Wysocki from the Department of Computer Science, Dr Rebecca Lee from The Christie Hospital, members of Research IT and members of the Digital Experimental Cancer Medicine Team (dECMT) based within the Cancer Research UK (CRUK) Manchester Institute. Research Software Engineers (RSEs) Louise Lever, Josh Woodcock, Catherine McGuire and Andrew Jerrison, and Research Infrastructure Analyst Richard Hoskins were involved from Research IT.
The CORONET website was first launched in December 2020 and then extended to incorporate additional features in March 2021. It uses the Research IT Web Application Development Service (WADS).
In November 2021 CORONET was selected for an NIHR Clinical Research Network award, within the “Trailblazers in COVID-19 research response” category. The award acknowledges the staff behind the incredible health and care research that took place in Greater Manchester during the pandemic.
Recent Peer Recognition for CORONET
In May 2022 a paper entitled "Establishment of CORONET, COVID-19 Risk in Oncology Evaluation Tool, to Identify Patients With Cancer at Low Versus High Risk of Severe Complications of COVID-19 Disease On Presentation to Hospital" was published, with several members of Research IT listed as authors.
The paper appears as part of the JCO Special Series covering COVID-19 and Cancer Care, and explains how CORONET has become a validated decision support tool available to Healthcare Professionals worldwide. It describes how the underlying model was created and how it can be used to support hospital admission decisions and help to predict COVID-19 severity in patients with cancer.
CORONET Overview
Coronet is comprised of two parts - a Machine Learning model and a publicly available website.
The model was developed using a set of international patient data and the clinical expertise of oncologists at The Christie Hospital in Withington, Manchester. The resulting model predicts the progression of a cancer patient's COVID-19 disease in the form of a risk score, based on their clinical measurements. It also provides a context for each patient (within the patient population) and an explanation of why the model arrived at its recommendation. This is important, because it supports clinicians in asking questions such as:
Q1: Have we seen similar patients before and what were their outcomes?
Q2: What is the clinical basis for this risk score?
The front end web application presents the model's findings and was developed by RSEs Louise Lever and Josh Woodcock.
CORONET Inputs and Outputs
Inputs
The website asks for patient information to be entered:
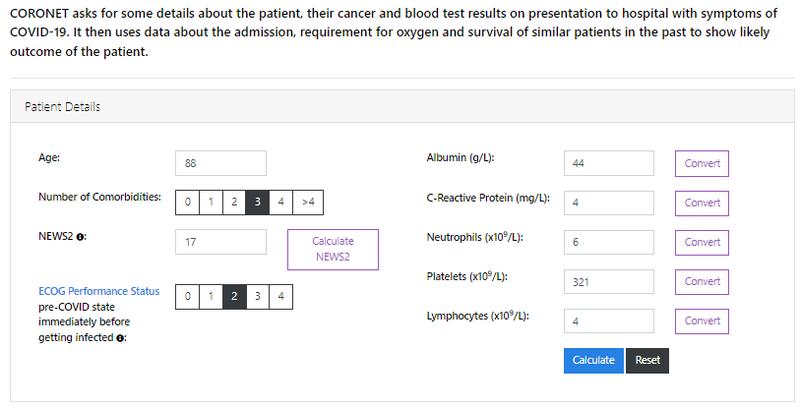
This data is passed to the model when the Calculate button is pressed. The website uses state of the art visualisations to display four different outputs.
Outputs
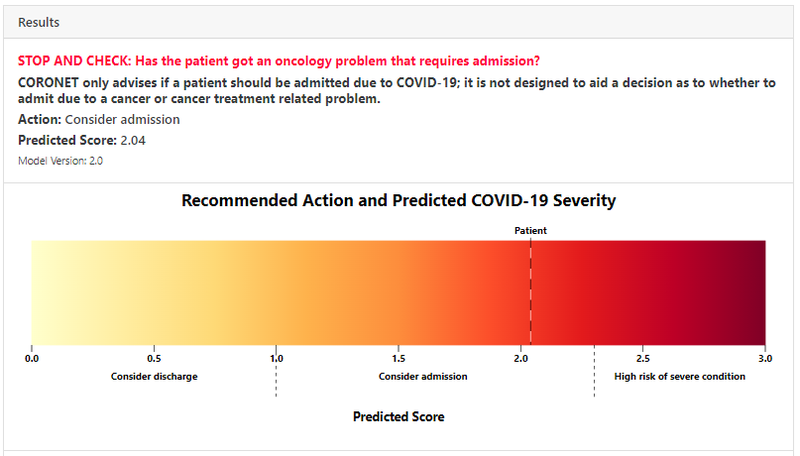
Output 1 - Patient Risk Score and Thresholds
Output 2 - Patient Context in Population
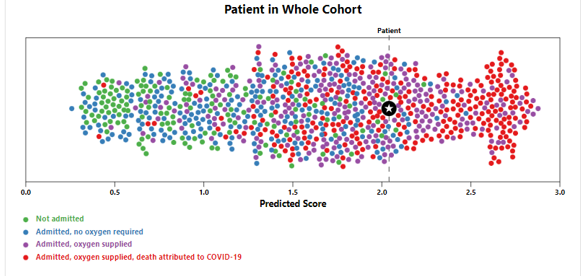
This "dot plot" allows a clinician to easily visualise the patient’s clinical context, relative to the outcomes in the full patient cohort and make him/her aware of model’s imperfection. It helps address Q1 above.
Output 3 - Details and outcomes for similar patients
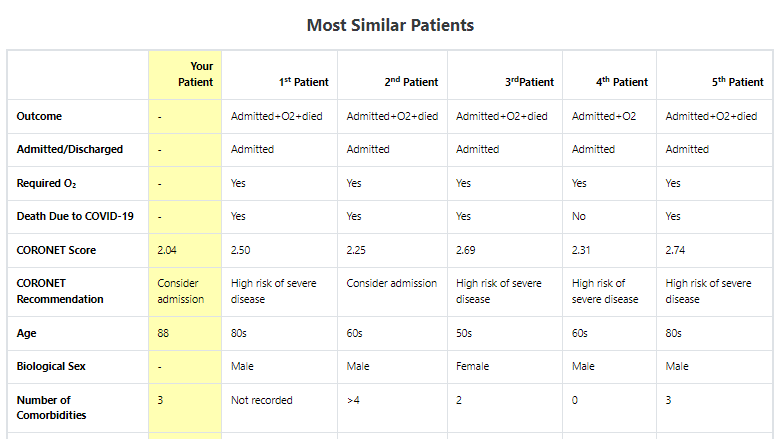
This shows a detailed breakdown of the most similar patients and also assists in addressing Q1.
Output 4 - Clinical Explanation of Risk Score
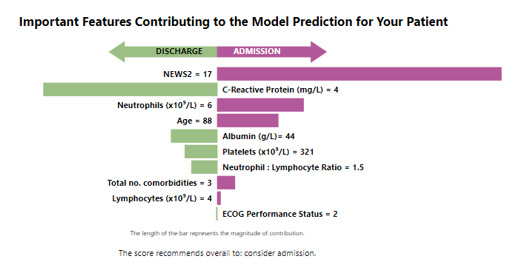
In the example above we see that National Early Warning Score-2 (NEWS2), Neutrophils measure and Age indicate a likely need for admission, whereas the C-Reactive Protein (CRP) value steers the risk score towards non-admission.
The signposts explain how the model has arrived at this prediction using clinically relevant terms, rather than detailed computational or machine learning terminology. These signposts will change for each individual patient prediction (since they are not constant to the model). This helps with Q2 above.
Model Creation
The model was created using patient measurement data (as the inputs), to predict the severity of how Covid would ultimately impact a patient (as the output).
This patient data consisted of clinical, hematologic, and biochemical measurements that were chosen based on a pre-specified list of features. This list was derived from factors associated with poor cancer outcomes, demographic/physiologic features, a literature review of features of COVID-19 severity and previous work.
In all 20 features were used including: Age; Platelets; Oxygen Saturation; Platelets; Urea.
The rankings of outcome classifications indicating disease severity were:
- [0] Admission not needed
- [1] Admission needed (≥ 24 hours inpatient)
- [2] Oxygen required (including ventilator support)
- [3] Death directly attributable to COVID-19 disease (not cancer)
Modelling was then based on the 0-3 point ordinal scale indicated above.
The goal, from a high level, was to firstly identify the most important features, and subsequently to use these features to develop a model which would use the values of these features to predict the patient outcome.
Data was collected for 2,137 patients in total.
Data collection and division
The full set of patient data was assembled using data collected in the Research IT REDCap service and sets of patient data obtained from Healthcare Institutes throughout the world.
Of the total data set of 2,137 patients, the dataset used for model derivation consisted of 1,743 patients and the external validation set contained 394 patients. Because of missing information the two sets were subsequently reduced to 920 patients and 282 patients respectively, meaning that data for 1,202 patients in total were used in the modelling.
Model Development
The model development workflow consisted of three steps (Derivation, Creation and Validation) with all statistical tests and modelling described below performed using R (version 3.6.2) and Python (version 3.7).
Step 1 - Model Derivation
This consisted of three stages: Data Resampling, Feature Selection and Model Selection
Data Resampling: In order to manage missing data and minimise bias, bootstrap resampling methods were used (followed by multiple imputation and oversampling) to generate 500 data sets.
Feature Selection: These data sets were then processed in order to identify the importance of each feature in predicting the patient outcome. Recursive Feature Elimination (RFE) methods were used, based on the Shapley Additive Explanation values obtained from Random Forest modelling.
This revealed that 10 of the 20 features were predictive of patient outcome, including: Age; Neutrophils; No. comorbidities; Albumin.
Model Selection: Once these 10 key features had been identified, Least Absolute Shrinkage and Selection Operator (Lasso) models and Random Forest (RF) models were created and compared. The RF model achieved lower Mean Squared Error and higher R-squared values than the Lasso model. The RF model was also more robust to collinearity.
Hence the Random Forest model was selected for CORONET model creation.
Step 2- Model Creation
The CORONET RF model was built by training the model on a balanced data set which included imputed data. The final model took the 10 feature values as inputs and provided a risk score as output.
Thresholds for this risk score were then derived using cross-validation and outcome balancing techniques. This produced two thresholds: A value above which the patient would require admission, and a value above which a patient would develop severe COVID-19.
Pragmatic clinical reasoning was also taken into account when determining these thresholds:
Admission Threshold: This was determined on the basis that it is safer to preserve a lower threshold (to maintain high sensitivity) to admit patients who are more likely to require supplemental O2 and have severe COVID-19 disease. This maintains high sensitivity at the cost of specificity.
High Risk Threshold: By contrast, in discussions with patients/families regarding the ability to predict prognosis and possibility of death, it was felt to be clinically more useful that the threshold for a patient becoming high risk should have better specificity, even at the cost of sensitivity.
Step 3 - Model Validation
Once the Random Forest model had been created, it was then validated using the data from an external validation cohort (validation set) of 282 patients.
CORONET achieved a sensitivity of 88% and a specificity of 31% for predicting admission and a sensitivity of 33% and a specificity of 83% for predicting patient mortality. Critically, in the external validation cohort it recommended admission for 94% of those patients eventually requiring oxygen and 98% of those who died.
Creation of Coronet Online Decision Tool
Having created and validated the model, it was then presented using a public facing website (as illustrated earlier) hosted on the Research IT Web Application Development Service (WADS). The website was developed using Django (a Python based web framework), Wagtail CMS (a content management system built on Django) with additional bespoke visualizations added by Research IT (utilising JavaScript, D3.js and SVG). These are illustrated in the earlier figures.
Summary
The Coronet Decision Support Tool has been a very successful collaboration between Research IT, the Department of Computer Science, the Christie Hospital and the dECMT. The tool not only provides a recommendation of the action that should be taken for a cancer patient with Covid, but also provides a context for this decision and an explanation of why the decision was reached. It is fitting that this work has now been further recognised by the publication of this article in an internationally renowned journal.
Further Information
CORONET Git - this contains the Python scripts used in the model and the functions for data processing, prediction, explanation and for finding similar patients in the dataset
The two journal papers below contain additional information about Coronet: Its successful use against different Covid variants, and the role of explainable Machine Learning models and uncertainty in clinical decision support:
1) This paper in "Cancers" explains how CORONET was validated on three Covid waves, including the most recent Omicron variant. Using another ‘external validation cohort’ it was shown that Coronet worked as well against later variants, providing strong evidence that the tool is still valid.
2) This preprint from "Artificial Intelligence"describes a study of the use of Coronet amongst Healthcare Professionals (HCPs). It investigates how the explainability elements of the Coronet Model impact user attitudes towards ML/AI based decision support tools. The paper concludes that communicating the uncertainty behind a model's recommendations is seen to be an even stronger requirement than explainability, in increasing the trust of HCPs towards ML models.
For further information please contact Research IT.