What is RAPapp?
Over the long lockdown summer months of 2020, one of the Mobile Development Service’s (MDS) projects has been the development of a cross-platform mobile app to facilitate a citizen science project around the rest-activity patterns of the general public. The brainchild of researcher Sophie Faulkner, who is both a doctoral candidate in the Faculty of Biology, Medicine and Health at the University and occupational therapist for Greater Manchester Mental Health NHS Trust, the project aims to analyse and quantify the effects of the various lockdown conditions on activity levels.
The app is built to offer four key features:
- To extract ethically approved data from users’ fitness tracker accounts and send them to secure data storage at the University.
- To gather responses from a connected REDCap survey and send these to secure data storage at the University.
- To generate a personalised “rest-activity pattern” (RAP) plot and allow users to interact with the plot in-app.
- To allow users to share their RAP plot via social media
How did we design RAPapp?
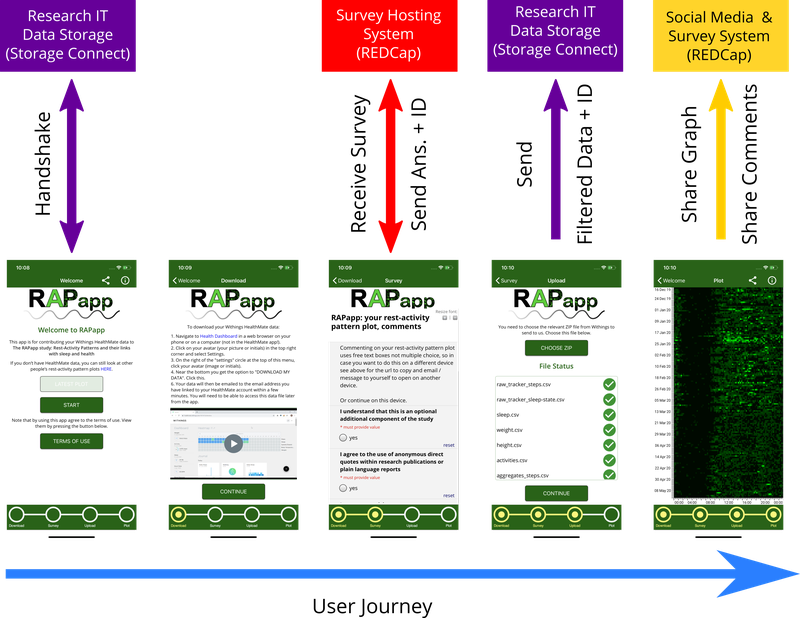
To meet our customer requirements, the MDS have built RAPapp to integrate Research IT data storage, a data feed from data provider Withings (formerly Nokia Health) and the accelerated scientific charting library SciChart. Users follow a 4-stage process through the user interface to prepare their data, answer the surveys and generate and share their plot. The enabling components are wired up to different stages of this process and are fired by appropriate UI elements. These backend components use a combination of MDS-developed client libraries, public APIs and Xamarin community plugins.

How are people using RAPapp?
Users must have (or sign up for) a Withings account. If users already use a Withings-branded activity tracker then they will already have one. If users have an Apple Watch, FitBit or other tracker, then Withings are working on supporting the import of data from the associated accounts.
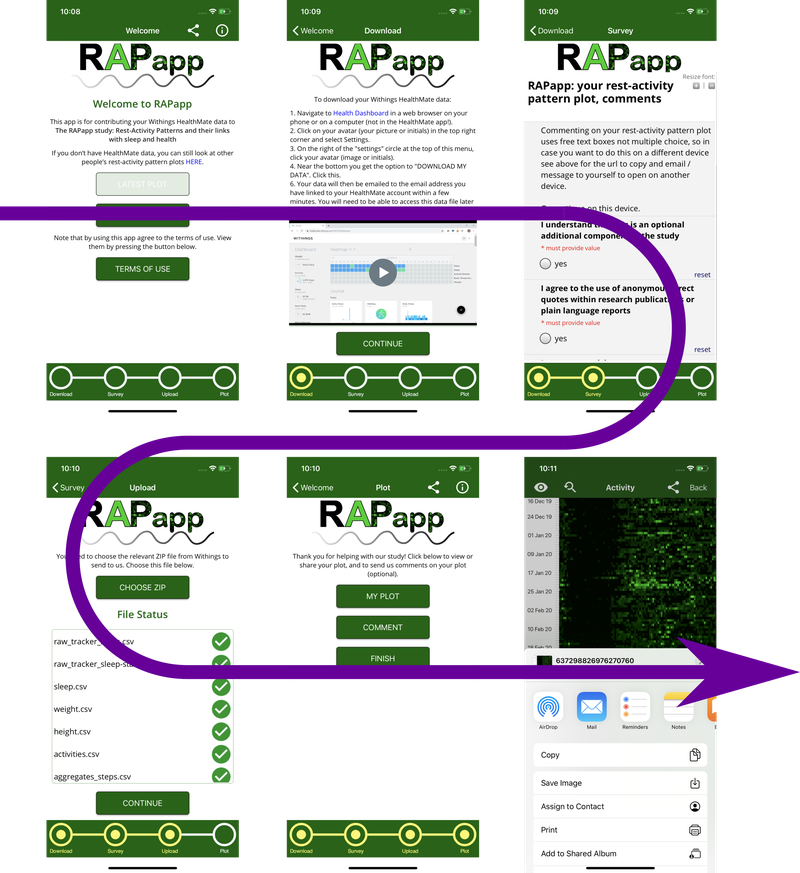
Once user data is all in their Withings account, users can open RAPapp on their device and follow the instructions to download their data as an archive. RAPapp prompts them to complete a REDCap survey then imports their archive into the app using an in-app file picker. Their archive is extracted and filtered to ensure only the data we have permission to collect is extracted from the users’ archive. The data is then automatically reorganised using a bin-packing algorithm. RAPapp then sends the data to our research data storage system.
The final page allows users to view a “heatmap” generated from the bin-packed data which we call a “rest-activity pattern plot”. The heatmap is rendered using the SciChart SDK and we have wired in a set controls for panning and zooming the graph as well as supporting pinch zooming and touch panning on some platforms. Users can provide feedback on their graph through another REDCap survey or share their graph via their own social media as RAPapp invokes native sharing options on each platform.

How do I contact the MDS?
The MDS is always looking to be flexible, adapting its processes to meet the ever-changing needs of our research community. If you have any suggestions for us, please contact us on the MDS email address and let us know.
To cost a developer onto your research proposal and secure us to work on your project, contact the MDS Lead (Adrian Harwood), send the team an email or use our Connect form.

