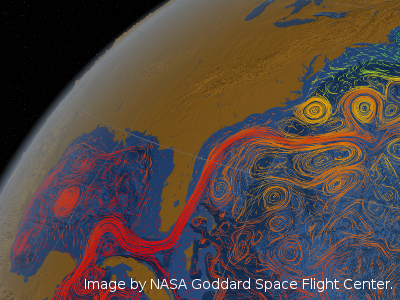
There will be some presentations on the state of data visualisation in different domains (social science, medical informatics, geographic information system) during the morning. There will be time for networking during breaks and hands-on sessions in the afternoon. In the hands-on session attendees will have the opportunity to create their own visualisations using their own data on a platform of their choice (Python, R, MATLAB and Javascript).
For further details, please visit the event website or register for the workshop at the Eventbrite page.

